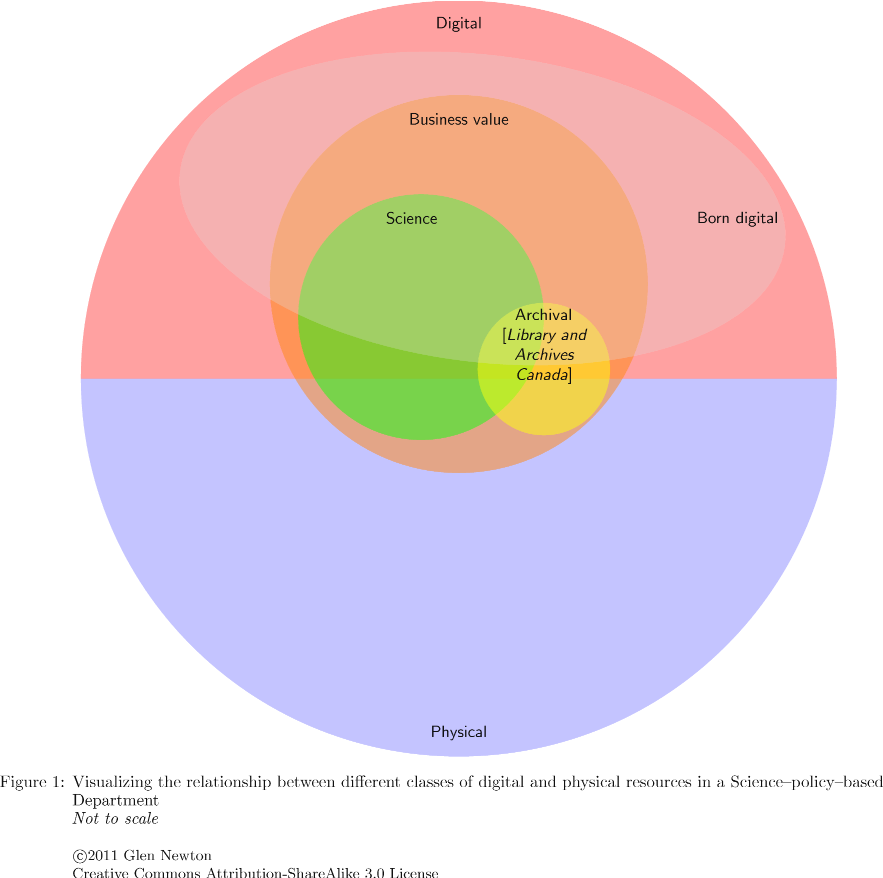
Visualizing the relationship between different classes of digital and physical resources in a Science-policy-based Department

Some of my work includes consulting with the Canadian Forestry Service (CFS) at Natural Resources Canada (NRCan) in the area of scientific data management, digital repositories / archiving and project management. Some of the work revolves around the interpretation and application of various records keeping and archival policies, such as those from Treasury Board Secretariate's Directive on Record Keeping and Library and Archives Canada. Some of these policies are difficult to interpret or are still in flux, and I have had some difficulties in interpreting the terms, definitions, etc. of these policies. I find that visualizing things (or the act of creating a visualization) can often help in understanding. So I've put together the following Venn diagrams to help (me mostly). I've tried to generalize to any Science-base-policy department in the government of Canada. Caveat : This is my own view of what I have seen and interpreted, and may be incorrect. It is not deri...