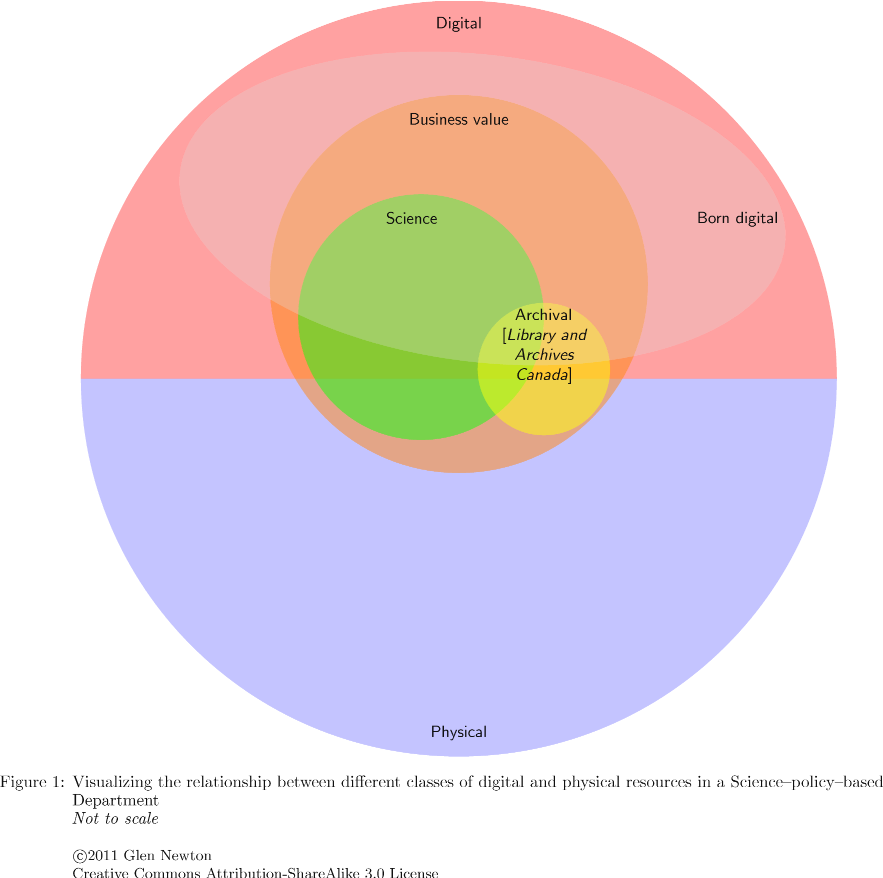
Visualizing the relationship between different classes of digital and physical resources in a Science-policy-based Department
Some of my work includes consulting with the Canadian Forestry Service (CFS) at Natural Resources Canada (NRCan) in the area of scientific data management, digital repositories / archiving and project management.
Some of the work revolves around the interpretation and application of various records keeping and archival policies, such as those from Treasury Board Secretariate's Directive on Record Keeping and Library and Archives Canada. Some of these policies are difficult to interpret or are still in flux, and I have had some difficulties in interpreting the terms, definitions, etc. of these policies.
I find that visualizing things (or the act of creating a visualization) can often help in understanding. So I've put together the following Venn diagrams to help (me mostly). I've tried to generalize to any Science-base-policy department in the government of Canada.
Caveat: This is my own view of what I have seen and interpreted, and may be incorrect. It is not derived from any private or proprietary information. It is also very possible that this does not correspond to how NRCan, CFS, LAC and TBS view these things. I am not a government employee and this is my own view.
Figure 1
Figure 2: Figure 1 may be a little too abstract to some, so I have a couple of exemplary and special case information resource media types to help show where these fit in to this framework.
Figure 3: Information resources not sent to LAC that are active and to be used / store over the long term need to be managed by the owning organization. This management can include institutional repositories and data centres (IRDC), along with a certain amount of process.
The IRDC do not include all resources of business value. Here I am thinking that the ephemeral business value resources will not make it into the IRDC. Again, I think this is correct.
I'd appreciate any feedback on this visualization; whether it makes sense and if it is fairly successful at representing the main classes of information resources at play in science-policy-based departments.
You can find a PDF of these diagrams on slideshare.
Some of the work revolves around the interpretation and application of various records keeping and archival policies, such as those from Treasury Board Secretariate's Directive on Record Keeping and Library and Archives Canada. Some of these policies are difficult to interpret or are still in flux, and I have had some difficulties in interpreting the terms, definitions, etc. of these policies.
I find that visualizing things (or the act of creating a visualization) can often help in understanding. So I've put together the following Venn diagrams to help (me mostly). I've tried to generalize to any Science-base-policy department in the government of Canada.
Caveat: This is my own view of what I have seen and interpreted, and may be incorrect. It is not derived from any private or proprietary information. It is also very possible that this does not correspond to how NRCan, CFS, LAC and TBS view these things. I am not a government employee and this is my own view.
- There are physical and digital information resources
- There are resources of 'business value'; some are digital, some are physical
- Science resources are all of business value; some are digital, some are physical
- Some resources of business value will be archived by LAC; Some science resources will be archived by LAC
- Some (most going forward) science resources and resources of business value will be born digital
Figure 2: Figure 1 may be a little too abstract to some, so I have a couple of exemplary and special case information resource media types to help show where these fit in to this framework.
- Artifacts, samples, & specimens are physical resources, some of which will be sent to LAC
- Some artifacts, samples, & specimens are science resources, some of which will be sent to LAC
- Documents, still & moving images are both physical and digital
- Some documents, still & moving images will be born digital
- Some documents, still & moving images are of business value, some of which will be sent to LAC
- Some documents, still & moving images are of science resources, some of which will be sent to LAC
- Huge data is extremely large volume data, that is of business value
- Huge data is mostly science resources value
- Huge data will never be sent to LAC value
Figure 3: Information resources not sent to LAC that are active and to be used / store over the long term need to be managed by the owning organization. This management can include institutional repositories and data centres (IRDC), along with a certain amount of process.
- IRDC include many resources of business value
- IRDC include most science resources
- IRDC does not include all huge data
- IRDC include both digital and physical resources, some documents, still & moving images and some artifacts, samples, & specimens.
The IRDC do not include all resources of business value. Here I am thinking that the ephemeral business value resources will not make it into the IRDC. Again, I think this is correct.
I'd appreciate any feedback on this visualization; whether it makes sense and if it is fairly successful at representing the main classes of information resources at play in science-policy-based departments.
You can find a PDF of these diagrams on slideshare.


Comments